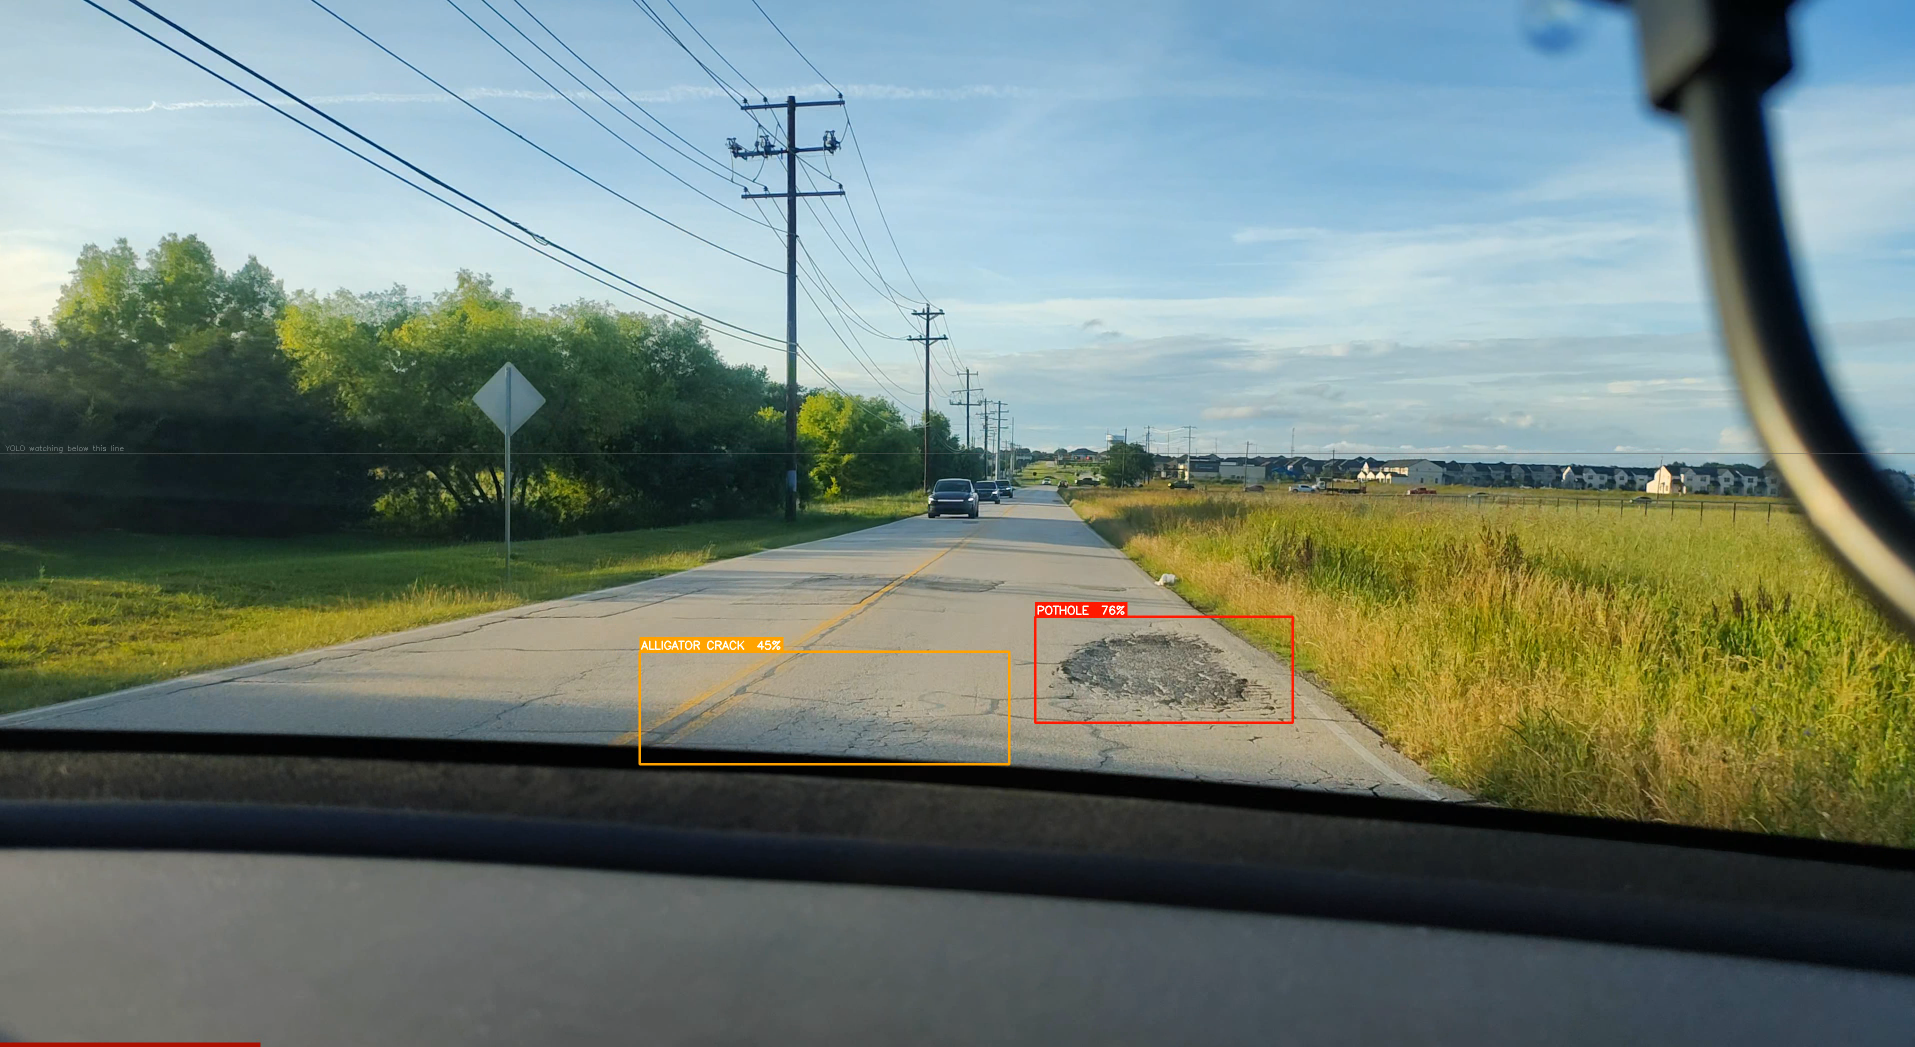
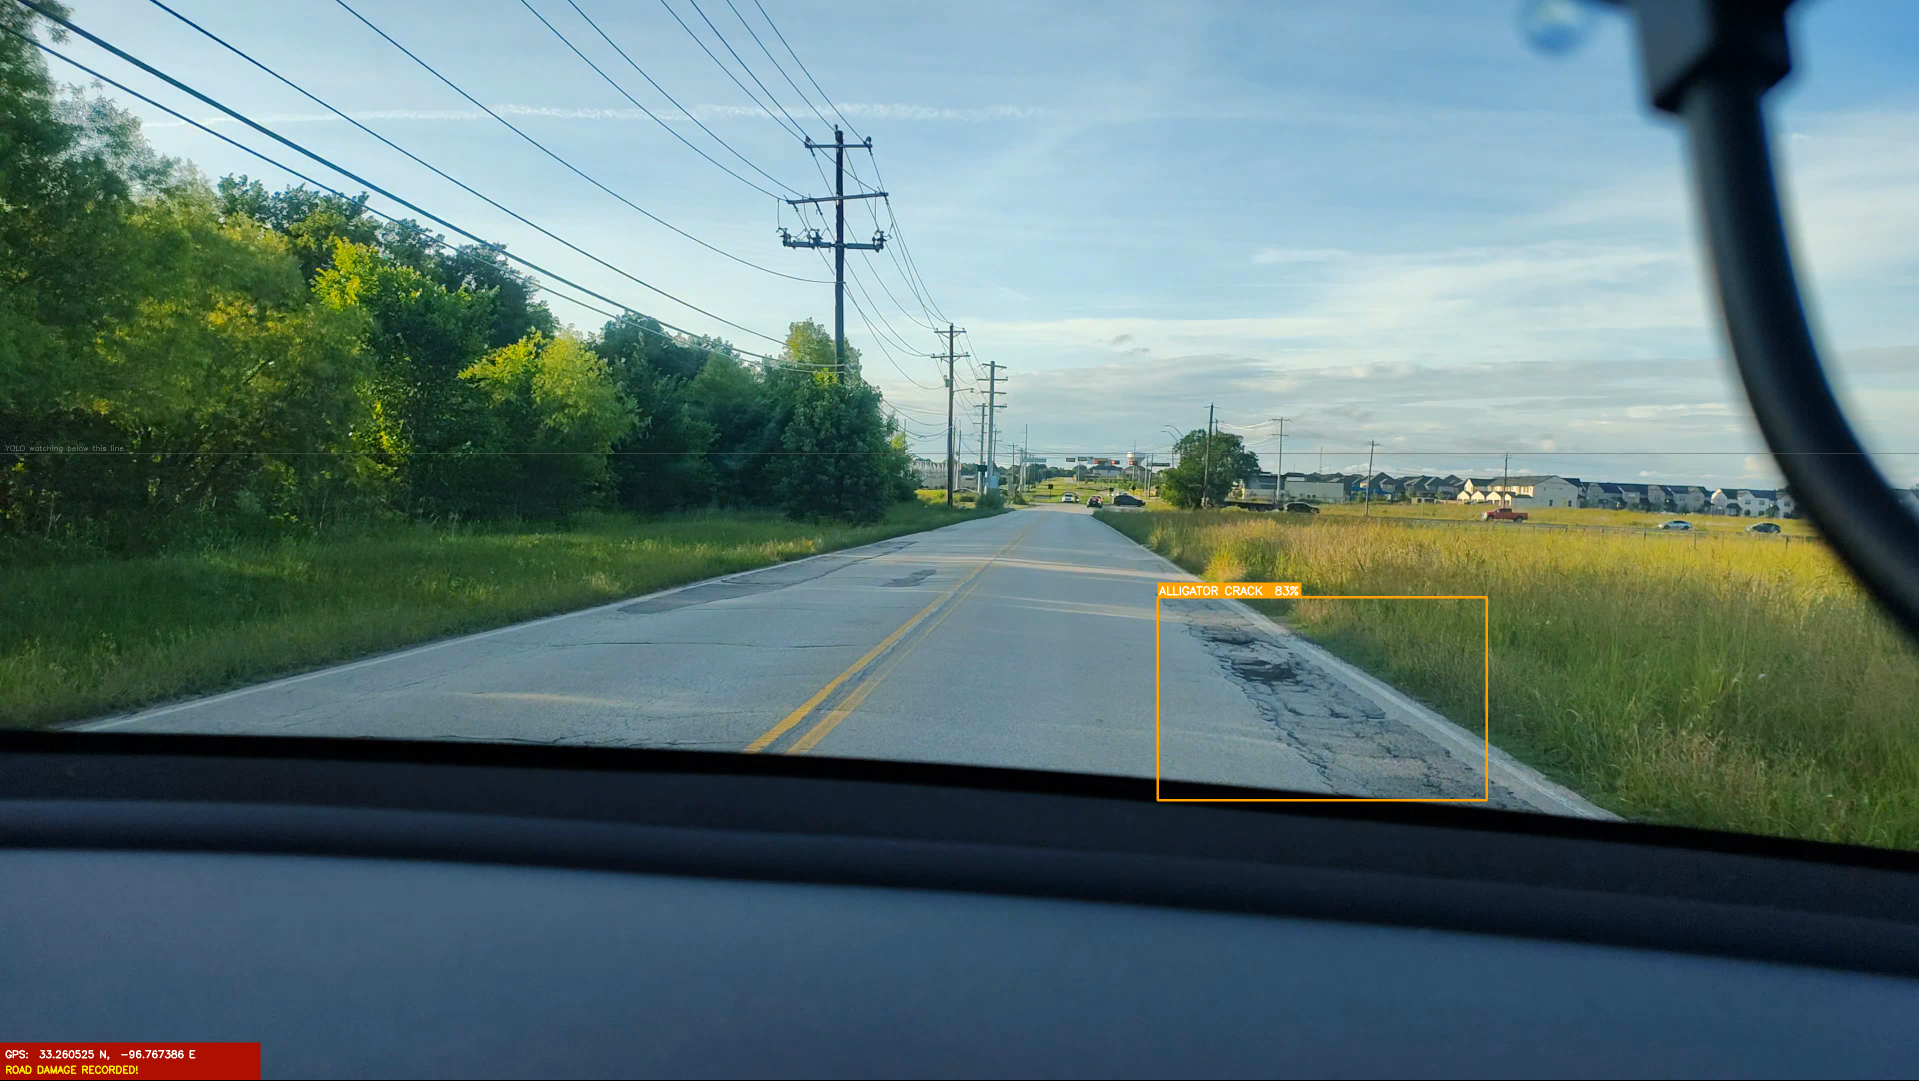
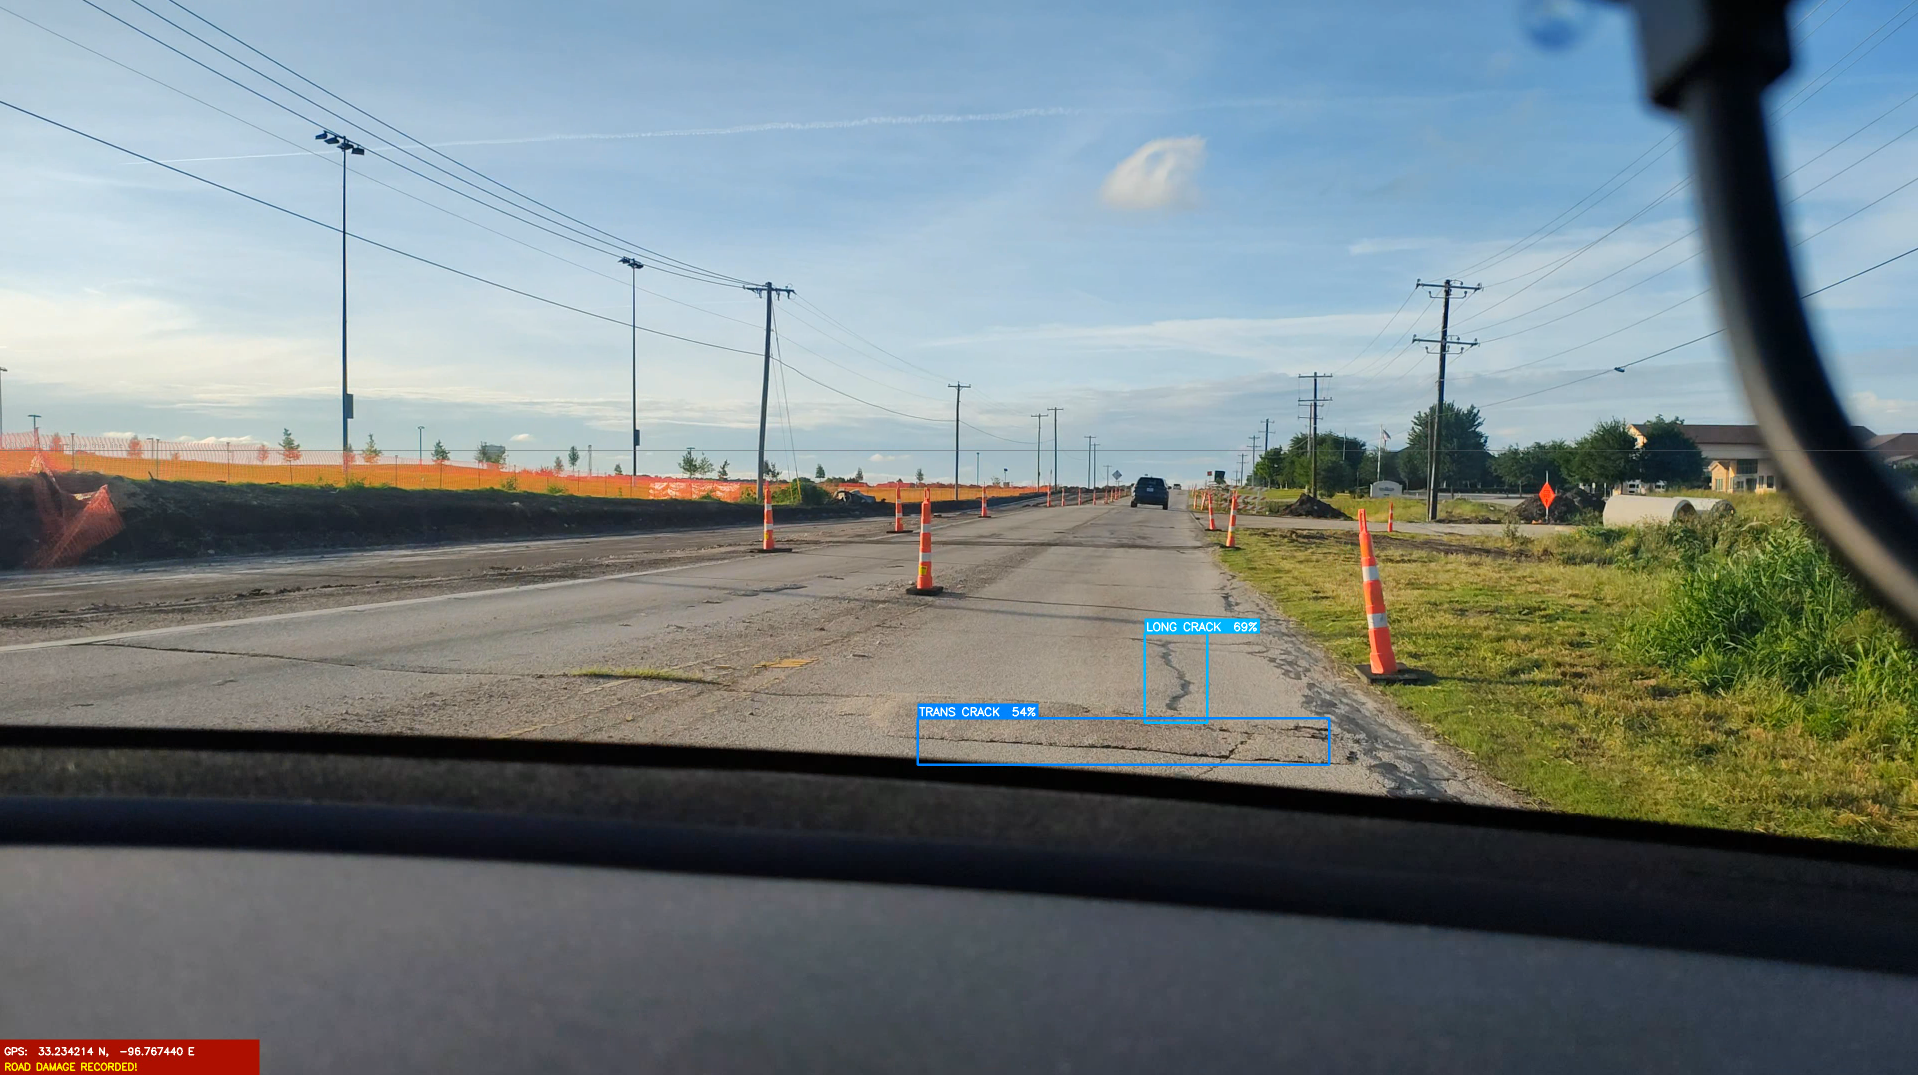
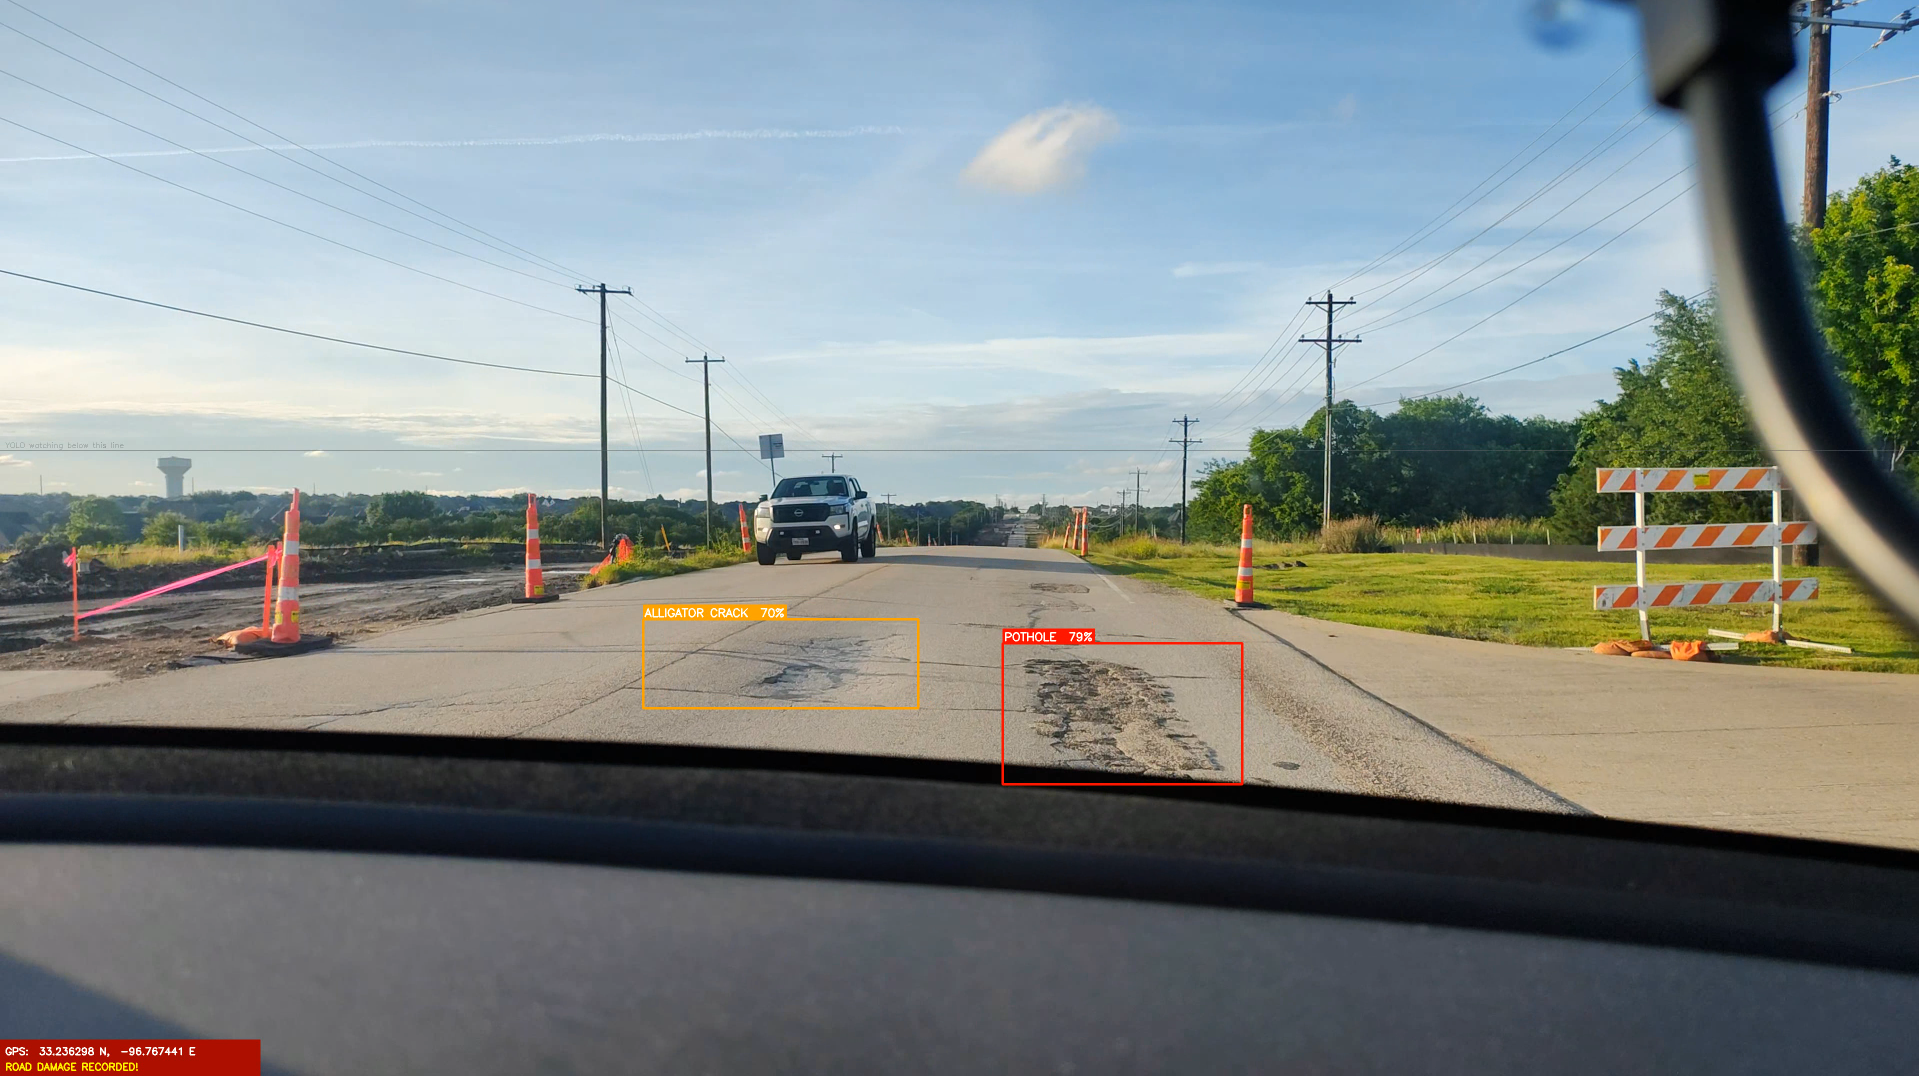
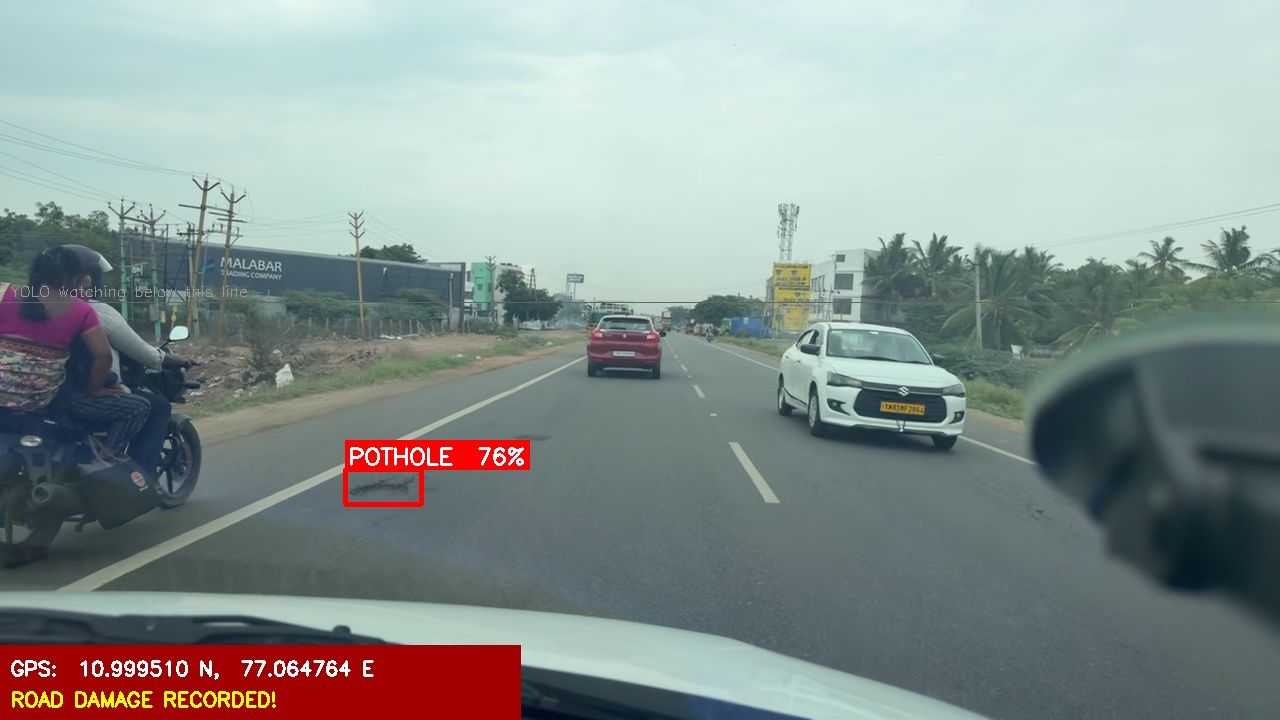
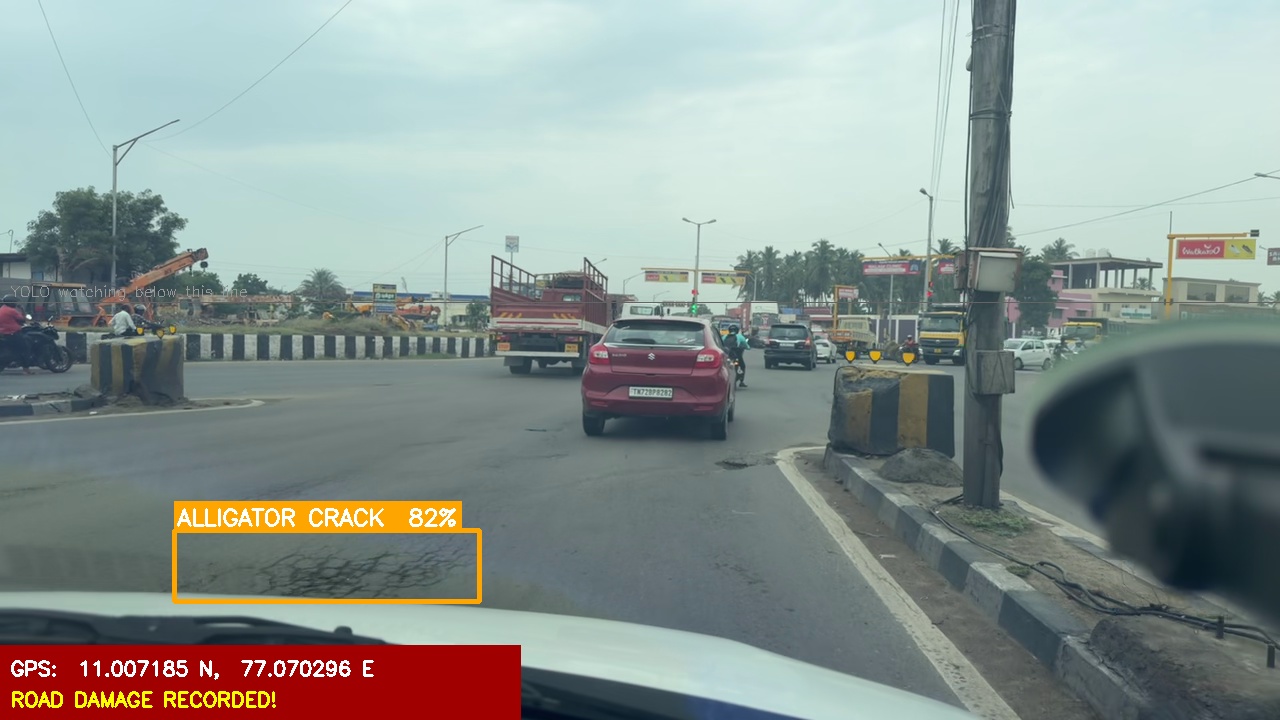
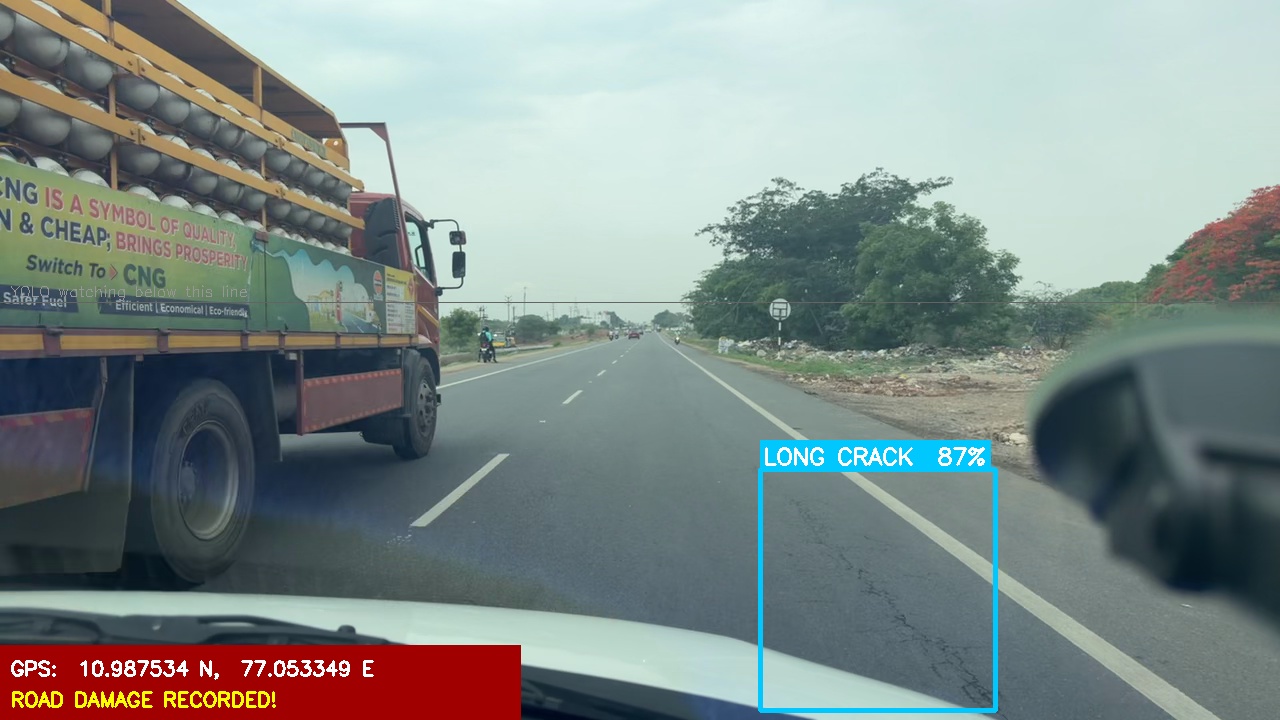
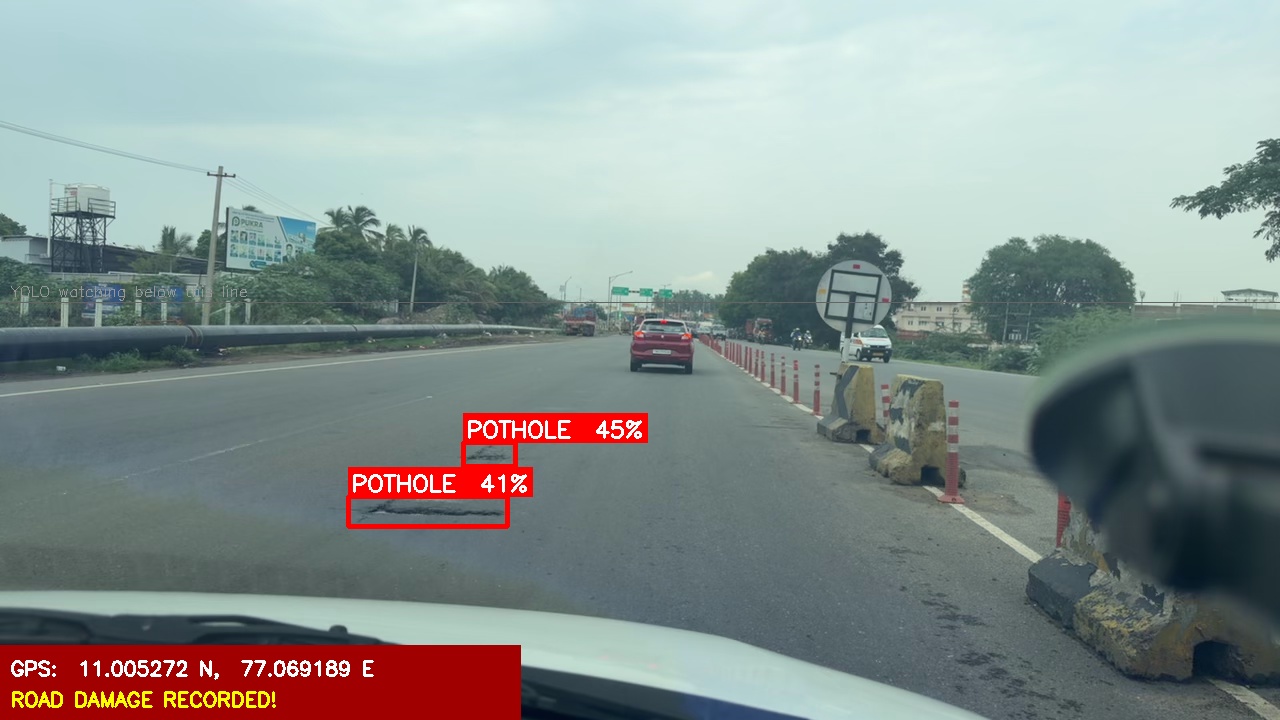
Real survey runs on roads — every frame analyzed, every defect located, every finding mapped automatically.
Each type indicates a different stage of road deterioration — from early surface cracking to full structural failure.
Every image below is an actual frame captured during the drive. Click any image to view it full screen.
A 2-minute highlight from our Frisco, TX survey run. Every frame is analyzed in real time — damage boxed, labeled, and GPS-tagged as the vehicle moves. This clip is from one of our field runs and is representative of the output the system produces across any surveyed corridor.
3.4M frames of road footage — every defect classified, scored, and mapped to its exact location on the corridor.
Every frame across the surveyed corridor was processed and reviewed — 30 frames per second of continuous road surface coverage, with no gaps in detection.
96% of detected damage is alligator cracking — a sign of deep structural failure across large sections of the corridor. Without intervention, these areas will deteriorate into active potholes.
All 192,600 detections are stamped with exact GPS coordinates. Repair crews can navigate directly to each site — no manual surveys, no guesswork.
The surveyed corridor shows damage across all four classification categories — from early surface cracking to active potholes. This depth of classification enables precise maintenance planning and budget prioritization at the corridor scale.
Nearby detections are automatically grouped into numbered clusters — click any cluster to zoom in and reveal individual pins. Red clusters contain potholes (D40); orange clusters are alligator cracks (D20). This map is from our Coimbatore, Tamil Nadu survey run and is representative of the output the system produces for any corridor.
🔴 Red pins = Potholes (D40) | 🟠 Orange pins = Alligator Cracks (D20) | Blue line = Full survey route